Golf Analytics

How Golfers Win

Tag Archives: 2013

The Intersection of Driving Distance & Accuracy

If you have ever watched televised golf I’m sure you have heard an announcer bemoan the wildness of a golfer’s drive. Tiger Woods and Phil Mickelson in particular seem to dogged by comments about how often they end up in the rough compared to the field.  However, I cannot recall hearing much talk at all about the distance golfers are hitting the ball. Now, a lot of that is due to it being easy to convey the advantage of hitting an approach shot from the fairway rather than the rough. We see the thick rough and remember the times golfers have been forced to pitch out into the fairway when they are behind obstructions. On the other hand, it’s difficult to convey the advantage hitting an approach shot from 20 yards provides to a golfer. However, that advantage is very real.

The 2013 ShotLink data shows that, on average, PGA golfers hit the green on 71% of their shots from 125-150 yards, but on only 64% of their shots from 150-175 yards. In his seminal Assessing Golfer Performance on the PGA Tour, Mark Broadie shows that, on average, a golfer will take 2.89 shots to finish a hole from 137.5 yards, but 3.00 shots to finish from 162.5 yards. In other words, driving the ball 25 yards further provides a substantial advantage in hitting greens and scoring low. There is certainly an advantage to avoiding the rough also. According to ShotLink data, golfers hit the green nearly 76% of the time from the fairway, but only 51% of the time when they missed the fairway. Birdies are 50% more likely when you hit the fairway versus the rough (21% to 14% of holes).

However, almost every golfer is forced to choose which skill – distance or accuracy – they want to attempt to excel at. Driving Distance and Driving Accuracy are strongly negatively correlated (R = -0.51), meaning that very few players perform well in both categories. For example, of the 216 golfers who exceeded 10 tournaments played or finished in the FedEx Cup top 200, Dustin Johnson ranked 1st in driving distance and 195th in driving accuracy. Rory McIlroy followed at 2nd in distance, but 181st in accuracy. Opposite those two, Russell Knox finished 1st in accuracy, but only 135th in distance, while Chez Reavie was 5th in accuracy, but only 159th in distance. As the following graph shows, only one of six PGA golfers exceed the mean for distance and accuracy (shown in red) and no one is +1 standard deviation from the mean in both distance and accuracy (shown in yellow).

2013 Driving Distance Accuracy Correlation

However, knowing that it is important to do both well, but difficult to do both well, is their one skill that predominates? To determine just how important each factor was to analyzing driving skill, I set-up a regression of driving distance and driving accuracy on a golfer’s greens in regulation (GIR). Because the courses played can vary in difficulty, I used my course adjusted stats which determines how much better or worse than field average a golfer performed each week in each stat. These adjust most slightly, but for golfers like Tiger Woods who typically play tougher courses than average the adjustment can be significant. I’ve attached a Google Doc of every PGA player to finish in the FedEx Cup top 200 plus anyone else with >10 tournaments entered showing these adjusted stats.

The results show that combining distance and accuracy predicts 50% of the variance in GIR (R^2=0.494). The p-values are highly significant and indistinguishable from zero, which certainly squares with the empirical stats provided in the second paragraph. To predict GIR, the equation is Y=(.00283*Distance in yards)+(.4418*Accuracy in %)-(.4429). Basically, hitting the ball an extra three yards is worth around 2% in driving accuracy, meaning a golfer should be indifferent to adding three yards of distance if it means giving up 2% in accuracy.

If a golfer was provided with the choice of being one standard deviation better than average in one skill and one standard deviation below average in the other skill there is almost no difference between being good at driving distance and bad at accuracy or vice-versa (63.9% for good at distance and 63.6% for good at accuracy). This shows that performing well at either skill is a legitimate path to success on Tour.

Using this equation, we can also calculate a Total Driving skill stat. The PGA Tour has such a stat, which they calculate solely by adding together a golfer’s rank in distance and accuracy. Mine simply ranks golfers based on their predicted GIR based on their driving distance and accuracy. The leader, Henrik Stenson, finished 8th in accuracy and 55th in distance, with a predicted GIR of 69.2%, meaning a golfer with average approach shot ability would’ve hit the green 69% of the time shooting from his average location. The worst golfer by this metric, Mike Weir, finished 213th in distance and 196th in accuracy, with a predicted GIR of 56.2%.

Tiger Woods, who is regularly criticized for his wayward drives, actually finishes 20th in Total Driving on the strength of his 34th ranked accuracy and 78th (above average!) accuracy. His predicted GIR was 66.6%. On the other hand, Phil Mickelson is also criticized for being wild with the driver, and he has been wild this season (58% accuracy; 163rd on Tour), but his distance has killed him nearly as much. He’s only driven it 288 yards on average (98th on Tour). As a result, he was the 149th best driver on Tour last year.

I’ve attached the predicted GIR/Total Driving stats in this Google Doc.

Best Rounds of 2013 (and the best round ever?)

The 2013 PGA Tour season concluded today at the Tour Championship. I hope to write some more comprehensive season retrospectives in the next few months, but with events remaining on both the Web.com and European Tours, a complete recap will come at the end of the calendar year. However, a short post on the best PGA Tour rounds of the season is appropriate. These are the top-five rounds relative to the field and adjusted for the strength of the field (so a 67 at Merion is roughly equal to a 61 at TPC Scottsdale).

5. Boo Weekley, 4th round at the Tampa Bay Championship
The Copperhead Course at Innisbrook is considered fairly difficult and averaged a 71.6 during the final round. Weekley started the round six back of the trio of Justin Leonard, Kevin Streelman, and George Coetzee and in 35th place, but jumped all the way to solo 2nd with a 63, 8.6 strokes better than the field. Weekley followed up this performance with his first victory since 2008 at the Colonial.

4. Keegan Bradley, 1st round at the Byron Nelson Championship
Keegan’s opening round 60 was the second on the PGA Tour in 2013, following Phil’s 60 at the Waste Management Open on a very easy TPC Scottsdale course. The field played TPC Four Seasons in 69.8 that day. Keegan entered the final round in the lead, but Sang-Moon Bae beat him by a stroke to claim his first PGA Tour title.

3. Tiger Woods, 2nd round at the WGC-Bridgestone
Tiger has always dominated at Firestone, but this year’s seven stroke victory was something special. His 2nd round 61 followed a first round 66 and opened up a comfortable seven stroke lead that he would take into the clubhouse Sunday. The field played Firestone in 71.2 during this round.

2. Matt Kuchar, 3rd round at the BMW Championship
This round got lost in the hoopla around the #1 round on this list, but Kuchar shot a 61 when Conway Farms played to a 70.3. Unfortunately for Kuchar, he started the round 16 strokes back of the leader and followed his 61 with a 73 to finish T24. His week was a pretty good example of why momentum likely doesn’t exert influence over golf performance.

1. Jim Furyk, 2nd round at the BMW Championship
It’s funny that Conway Farms was lit-up for the two best rounds of the year as it actually played much more difficult than either East Lake or TPC Boston, which saw a 64 and 62 as the lowest rounds. The field shot 71.1, meaning Furyk’s round registered around 13 strokes better than what an average PGA Tour player would’ve shot that day. Like Kuchar, Furyk didn’t play particularly well in the other three rounds and settled for solo third.

I haven’t checked my entire database, but I’m pretty confident it is the best round on the three major tours since at least 2008. The other two 59s (Appleby in 2010 at the Greenbrier and Goydos in 2010 at the John Deere) came on very easy courses, as did David Duval’s 59 at the 1999 Bob Hope Classic and Chip Beck’s 59 at the Las Vegas Invitational. Bill Barnwell investigated where it ranks all-time at Grantland and determined it was 9th best all-time. He didn’t adjust for the talent of the field however (the BMW field was around 0.3 standard deviations better than PGA average) which would boost Furyk’s round above all but the top four on Barnwell’s list and make it the best round since 1996.

What’s Changed – Zach Johnson

This week the Tour travels to Illinois for the John Deere Classic, a birdie-fest notable for the poor field it attracts in advance of next week’s Open Championship in Scotland. After winning last season, Zach Johnson has been installed as the second favorite by bookmakers and fantasy columnists, behind 2009-2011 champion Steve Stricker and ahead of Louis Oosthuizen and Keegan Bradley. This on its own is not particularly notable; past champions who also happen to be good players are considered favorites at most events, especially when the John Deere field contains only four of my top 25 players by both Z-Score and OWGR. What is particularly strange here is that Zach Johnson has been thoroughly mediocre so far this season. After a four year streak from 2009-2012 that marked him as a consistent top 25 player in the world by Z-Score (between -0.62 and -0.35 all four seasons), he’s fallen off precipitously to -0.13 over 51 rounds. Now, golfers play more poorly than normal over half seasons due to plenty of factors ranging from random variation to injury to genuine deterioration of skill. I’m not as concerned about whether Zach Johnson will continue to play well below his career average as I am interested in just why he’s playing so poorly this year and which parts of his game are responsible for the regression.

First, I will examine what made Johnson such a prolific player in past seasons, specifically focusing on 2012. This analysis will be using the Strokes Gained method, breaking down shots into Putting, Driving, Approach shots, and Scrambling shots. For this, I’ve created Strokes Gained – Driving, Strokes Gained – Approach Shots, and Adjusted Scrambling using publically available PGA Tour stats, and will use the PGA Tour’s own Strokes Gained – Putting stat. I have already explained how my Adjusted Scrambling stat is calculated; the other two will be introduced in coming weeks. For now, it’s important to know 1. the stats are measured in strokes above and below the field and 2. I try to isolate how well a golfer is performing in one area by adjusting for distance of shot, starting position, and what happens in subsequent shots.

Zach Johnson’s 2012 was a great season. He ranked 20th in the world according to my Z-Score Method, won two tournaments, earned four other top tens, and missed only a single cut. His success was driven by great putting and approach shots – he ranked 5th and 7th in those metrics, saving a total of 1.4 strokes relative to the field. His tee shots were a weakness, but cost him less than 0.1 strokes. He made up an equal number of strokes by scrambling well above-average, which combined with his great putting kept him out of bogey trouble when he missed the green. In short, he was as efficient as all but the most elite (Tiger, Rory, Adam Scott) golfers, performing well in three areas, while minimizing his losses in the weakest part of his game.

This season everything has gone off the rails. Starting with his approach shots, Johnson has fallen from 5th to barely above-average, and that’s the only part of his game that has even been above-average. He’s never rated highly in Greens in Regulation because, as a very short driver, he faces longer approach shots. Because of that it’s hard to get a sense of a decline in this area just by looking at the normally cited stats (he’s actually improved his GIR rank from 2012). In 2012, his approach shots yielded 2.72 expected birdies (sum of the probability that a birdie putt will be holed based on its distance). This figure ranked 45th on Tour, despite Zach Johnson hitting his approach shots from much further distances than most of the elite players. This year, he’s ranked only 112th.

More damaging has been his putting. Johnson was 7th on Tour in Strokes Gained – Putting in 2012, gaining 0.6 strokes on the field per round just from putting. For whatever reason, Johnson has really struggled on the greens this year and has essentially been average, losing 0.04 strokes versus the field this year. That itself is stunning. He had scored seasons of 0.38, 0.58, 0.57, and 0.60 strokes gained/round since 2009, and suddenly looks no different than the average Tour golfer at putting. I can speculate about all sorts of reasons for this decline – less practice, less preparation, age related yips, etc. – but obviously this is a huge problem. Johnson cannot return to his old form without regaining his putting stroke. Plenty of guys (Vijay, Adam Scott, Lee Westwood) are or have been great players despite not being good putters, but they’re fantastic tee-to-green players. Johnson needs to compensate for his inability to drive the ball far.

Johnson’s has struggled scrambling this year, but not to the point where it’s costing him more than a few hundredths of a stroke/round, and his driving hasn’t noticeably changed. But it’s apparent that all the decline we’re seeing from Zach this year is due to his inability to generate good looks for birdie and to putt at an elite level. I’d certainly bet on him regaining his form – he’s still only 37 and has extensive history of high level play – but I think it’s crazy to consider him a better player at this point than Keegan Bradley or Louis Oosthuizen.

Greenbrier Classic – Final Round

If we ever needed a lesson that golf is inherently random and statistics can only do so much to predict what will happen, Sunday’s final round at the Greenbrier certainly provided it. Johnson Wagner entered the final round leading Jimmy Walker by two strokes, with Jonas Blixt sitting three back. By the time Wagner was teeing off on #10 to start the back nine, Walker had not managed to close the gap at all, while Blixt had birdied #9 and #10 to get within a single stroke. From there, Blixt used several fantastic approach shots to set-up birdies, while Wagner made three crucial bogeys to fall out of the lead – handing Blixt his second PGA victory in less than a year. My analysis of the back nine will attempt to quantify strokes gained and lost on the field by each shot Wagner and Blixt made on the back nine, similar to my look at the Travelers.

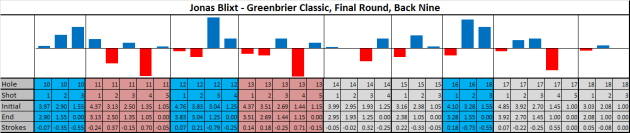
What was remarkable random about the back-nine was what shots Blixt hit to set-up birdies. Blixt is fairly categorized a player very reliant on his putting for success (he was 2nd in 2012 and 47th this season). He does not hit his approach shots well, sitting nearly at the bottom in GIR, even when we account for his below average performance on tee shots. However on Sunday, Blixt’s two best shots were his approaches on #12 and #16 that set-up birdies – both worth around 3/4ths of a stroke. On the flipside, his normally sterling putting failed him on #11, #13, and #17 setting up two bogeys and depriving him of what would’ve been a decisive birdie.

On the par 5 #12, Blixt sat 108 yards from the hole after his lay-up. From there the average player hits to around 20 feet. Instead, Blixt hit a beauty to five feet, setting up a birdie that tied him with Wagner at -13. Later at the par 4 #16, Blixt was 173 yards in the fairway, a location from which the average pro hits to around 30 feet. Blixt hit an iron to nine feet, producing a make-able birdie putt that he drained to draw ahead of Wagner at -13. His approach here was his 2nd best of the day, behind the approach on #12, and his subsequent putt was his 3rd best shot.

However, along with those great approaches came three awfully poor putts which resulted in a par and two bogeys. On the long par 4 #11, Blixt missed the green, but chipped to 6 feet. PGA players make 2/3rds of those putts; Blixt not only missed but ran it three feet past, leaving a miss-able putt for bogey that he made. He hit another equally poor putt on the long par 4 #13. After laying-up, Blixt hit to 7 feet, but blew his par putt four feet past the hole. He would make the four footer for bogey. Again on the par 5 #17, Blixt was standing over a 7 footer that would’ve put him three clear of Wagner. Seven footers are 55% putts normally, so Blixt’s miss cost him over half of stroke, but at least he didn’t blow it several feet past the hole.

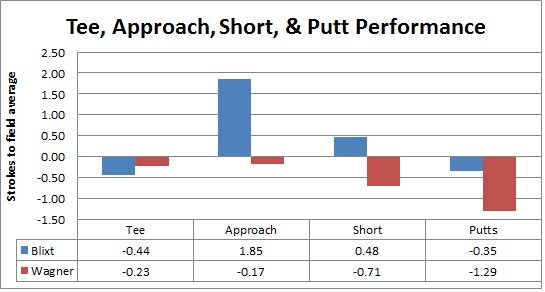
In total, Blixt’s back nine shots were worth: -0.44 strokes (tee shots), +1.85 strokes (approach shots), +0.48 strokes (short game), and -0.35 strokes (putts).

blixtgreenbrier

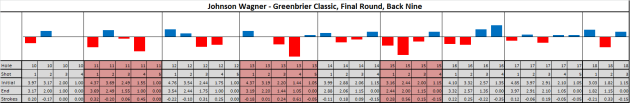
Johnson Wagner’s back nine was, succinctly, a disaster. He began it with a two stroke lead over Blixt that was quickly shortened to one stroke after Blixt’s birdie ahead of him on #10. At this point, no one else was any better than -11, while Wagner sat at -14. From there, Wagner bogeyed three of the next five holes and watched Blixt draw two strokes ahead of him for the win. For a guy who has been a steadily good putter (29th, 39th, and 41st in Strokes Gained in 2011-13), the flat stick failed him on Sunday. Two of his three worst shots were missed par putts inside 10 feet (on #11 and #13).

It was #15 that really sunk him though. He started #15 even with Blixt at -12. As we saw earlier, Blixt would go onto birdie #16, but Wagner would not have been in terrible position if he had parred #15 and moved on, as 16-18 aren’t difficult holes. His tee shot on the par 3 #15 was poor, ending up in the rough 14 yards from the pin. From there, PGA players bogey about half the time. Wagner blew his next shot 33 feet past the pin, leaving him a nearly guaranteed bogey. Within 15 minutes between Wagner’s bogey on #15 and Blixt’s birdie on #16, the  tournament was all but over.

For the back-nine, Wagner finished -0.23 strokes (tee shots), -0.17 strokes (approach shots), -0.71 strokes (short game), and -1.29 strokes (putts), a thoroughly miserable performance for a guy who is a PGA Tour player because of his ability to putt.

wagnergreenbrier

greenbrier component stats


What’s Changed? – Billy Horschel

One of the most significant stories on the PGA Tour this year has been the emergence of Billy Horschel as one of the best golfers week in and week out.. After racking up only three top-tens in his first two largely mediocre seasons on Tour, Horschel’s earned a top-ten in seven of seventeen starts this year, missing only a single cut along the way, and earning his first Tour victory in New Orleans. His arrival to the general golf public came at the US Open where he was in the final group Saturday and finished T4.

The incredible thing about Horschel’s emergence has been how poor he played in his first two years on Tour. He entered the Tour in 2010 through Qualifying School after a brilliant collegiate career at Florida, but made only four starts due to an injury. He re-earned his card in Qualifying School again, but had a poor year (+0.14 by my Z-Score Method & only 140th on the Money List). His conditional status in 2012 only allowed him to finish 147th on the Money List (-0.12 by Z-Score for PGA and Web.com rounds), but he managed to again qualify for the Tour in Q-School. So through two full seasons, he had shown himself to be roughly PGA average. In 2013, though, he’s played to -0.50 – the 18th best performance in the world.

While it’s not completely unheard of for a player to improve as much as Horschel did, it is very rare. Horschel’s improvement from 2012 to 2013 was -0.39 standard deviations. That is the 19th largest improvement from one year to the next in the last five seasons, from a sample of over 800 pairs of seasons (I restricted my examination to golfers with 50+ rounds in each season). Many of the improvements ahead of him are from golfers with established high levels of performance regaining form, such as Jim Furyk in 2012, Adam Scott in 2010, Sergio Garcia in 2011, and Angel Cabrera  this season. Whether due to nagging injury, personal trouble, lack of focus/preparation, etc. those guys fell from performing at a high level, but were able to regain their form the next season. Other golfers went from being extremely bad (below Web.com/European Tour average), to just mediocre. Much rarer  are the genuine breakthroughs where a golfer goes from being quite average to very good. Among those ahead of Horschel, only Webb Simpson in 2011 improved from average or better to playing elite level golf.

So how is Billy getting it done? What has he improved on since last season that has allowed him to earn the top 10s and maiden victory? To examine this I’m going to use what I’ll refer to as Component Stats. These are stats measuring how well a player scrambles, drives the ball, hits approach shots, and putts. To measure performance, I’ve created three of my own stats plus I’ll be using the publicly available Strokes Gained – Putting. For the other three, I’ve already introduced Adjusted Scrambling and I’ll be introducing my Approach and Driving stats in the next few weeks. For now, just remember that the stats are measured in strokes above and below the field and try to isolate how well a golfer is performing in one area by adjusting for distance of shot, starting position, and what happens in subsequent shots.

By this method, in 2012, Horschel was only substantially better than PGA Tour average at driving – where he gained nearly half a stroke on the field. He was average at scrambling, slightly below average at putting, and slightly above average at hitting approach shots. In short, he was much like dozens of other Tour golfers who survive because they’re very good at one skill and good enough at everything else. What separates the elite from those golfers is the elite only have one weak spot in their game. Of the best 25 golfers by Z-Score in 2012, only Robert Garrigus ranked below average in more than one of the four statistical components. Only three of the top 50 (Ben Curtis and Lee Westwood also) ranked below average in more than one category. As long as Horschel could only rely on his driving, he was not going to be able to distinguish himself.

I have no particular insight into what Horschel changed in his preparation in 2013; people have credited maturity gained from working with a sports pyschologist. What I do know is that Horschel has delivered far better performances putting and hitting approach shots this season. His Strokes Gained Putting has improved from -0.09 to +0.50 strokes this season – one of the largest improvements year-to-year – and improved by almost a half a stroke on approach shots; a total improvement of a full stroke. Horschel’s driving has remained well above average, and though his scrambling has regressed by 0.20 strokes (he’s only successfully scrambling 59% of the time despite putting lights out overall and hitting from closer lies), that hasn’t hurt him much.

horschel12&13


All in all, Horschel’s improvement has been worth 2/3rds of a stroke. A to-be-posted regression analysis shows that golfers a stroke better than PGA Tour average earn ~$65,000/tournament more than average golfers or about $1.5 million over a typical season, just to provide a financial benchmark to evaluate his improvement.

The question now is whether Horschel can maintain his performance going forward. My research has shown it’s correct to regress samples of around half a season by adding 25 rounds worth of average performance. That would expect Horschel to perform at around -0.36, equal to something like the 35th best player in the world. My weighted and regressed two year Z-Score method predicts something similar. However, if Horschel has made genuine changes to his preparation and mental approach to the game, we may not be seeing a golfer playing above his head, but rather one pushing his ceiling higher.